Climate Change Visualization
This is a data visualization tool/game meant to show what effort it will take to reduce carbon emissions by replacing carbon emitting buildings with renewable sources.
This was originally a Game Jam for the IGDA Climate SIG that lasted Two weeks but I had so much fun working on the tools that it became more of a visualization project instead of a game.
The goal of this project was to imagine what if we replaced all coal/gas plants In the US with a renewable equivalent how would that affect the Green New Deal’s goal to reach net-zero global emissions by 2050.
Type in your zip code on a physical keypad and get the local weather displayed on the screen.
To do this I use the National Weather Service (NWS) API to find the nearest forecast office from a given latitude/longitude and get the forecast from that office. What I realized pretty quickly is that most people do not know their longitude/latitude by heart so i use another API to convert a ZIP code to a longitude/Latitude.
List all gas/coal plants in the US and place them on a virtual globe that the player could move, rotate and scale.
The Global Energy Monitor was a great resource for data and had a list of what i needed as a excel file. I used the longitude and latitude in the excel data to map each plant to a point on the globe. To let the player move, rotate and scale the globe i used a combination of pinching and dragging for the left and right hands.
Visualize and sort power plant data.
Let the player select any plant in the US and visualize the data such as Combustion Technology, Construction Date, Annual CO2 Emissions, etc.
This video shows the current walkthrough of me manipulating the globe, selecting a power plant to look at its real world info and entering in a zipcode to see the current weather.
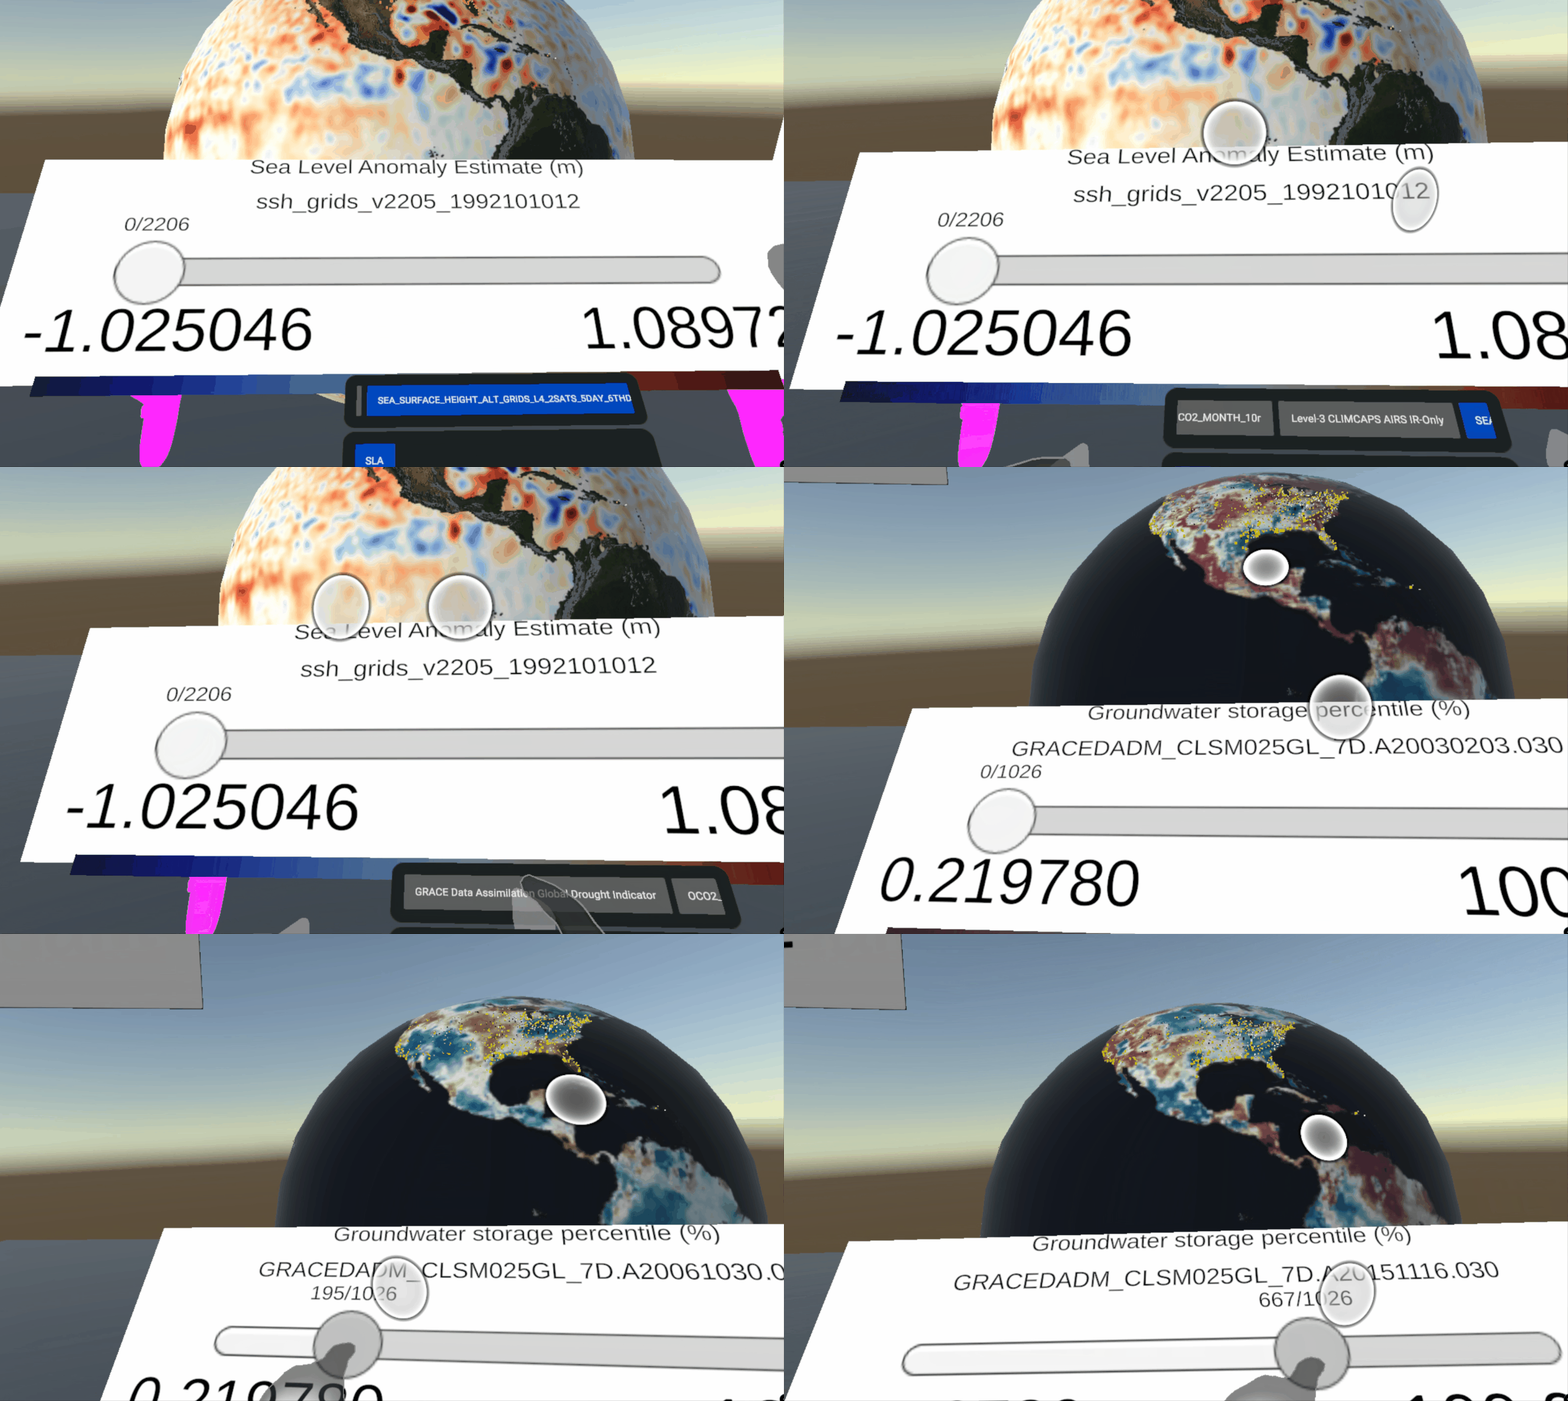
Visualize NetCDF/HDF5 data:
Using my editor tool, I extracted 2D arrays from datasets and can view the results on a globe in VR.
Display data from missions such as GRACE, OCO-2, MEaSUREs-SSH and AIRS and plot a generated heatmap in front of you.


